Disclosure: there are affiliate links below, to the Garmin Fenix 8 and to Beet It Sport. I bought both with my own money. If you buy through a link I might earn a small commission, which costs you nothing and does not change what I write.
It is 3am and I am cross-referencing a Garmin export against a Hilo blood pressure report. That sentence tells you most of what you need to know about how I spend the small hours. The monthly data dump landed today: two exports, two devices, one middle-aged body, thirteen months of history sitting in a spreadsheet. And for the first time since I did my knee last December, the lines are pointing the right way. The clearest of them is a fortnight of heat acclimation running that took ninety seconds a kilometre off my usual loop.
This is an interim report, not a victory lap. I am still heavier, slower and higher-pressured than I was in the summer of 2025. But something turned a corner in the last two weeks, and the receipts are clear enough that I am allowed to be quietly pleased. So I am going to be.
The run that felt like proof I was done
On 26 June I ran my usual loop around Flintshire, roughly eight kilometres, the same route I have plodded a hundred times. It took me 9:36 per kilometre. That is not a running pace. That is a brisk-shuffle-with-opinions pace. My average heart rate was 142 and it felt like 180. It was the peak of the hot spell, and I finished it genuinely wondering whether the knee injury had quietly ended me as a runner: six months on and still going backwards.
Here is what the export showed me at 3am. It hadn’t. That run was the bottom, not the trend.
Heat acclimation running: the fortnight in receipts
Same loop, same distance, tracked on the same watch. Here is the whole arc.
| Date | Pace (min/km) | Avg HR | Max HR | What happened |
|---|---|---|---|---|
| 22 Jun | 8:56 | 137 | 170 | Pre-heat baseline |
| 24 Jun | 8:58 | 141 | 160 | Heat building |
| 26 Jun | 9:36 | 142 | 159 | Worst day, peak-heat struggle |
| 27 Jun | 9:17 | 133 | 146 | Capped and walked, on 4.3 h sleep |
| 29 Jun | 8:07 | 139 | 160 | Turnaround, after 7.2 h sleep and a rest day |
| 30 Jun | 8:42 | 131 | 149 | Efficiency landed, fastest for the heart rate |
| 1 Jul | 8:04 | 145 | 175 | Fastest, pushing hard by choice |
Read down the pace column, then read it again. From the 26 June low to 1 July I took roughly ninety seconds per kilometre off the same route, at a similar or lower heart rate. On a hilly eight-kilometre loop that is not a rounding error. That is the engine coming back.
The run I keep looking at is 30 June: 8:42 per kilometre at an average heart rate of 131. That was the lowest-HR run of the entire block, and one of the quickest. Same output, less cost. If you want the single clearest fingerprint of aerobic fitness returning, that is it.
By 1 July I ran 8:04, my fastest of the fortnight, and the difference was that I was pushing hard because I chose to, not shuffling because the heat was forcing me to. None of this is mysterious. It is textbook heat acclimation running, landing right on schedule at about day seven to ten.
Why the heat wrecks a run at a heart rate that should feel easy
When it is hot, your body has a problem of allocation. Running muscle wants blood for oxygen. Your skin wants blood at the surface to shed heat. Both are non-negotiable, and there is only so much blood to go round, so the two compete.
To cover the shortfall the heart simply beats faster for the same effort, which is the cardiac drift you feel as a steady run quietly turning into a grind. On top of that you sweat out plasma, so the actual volume of fluid the heart is pumping shrinks, and a smaller stroke volume means an even higher heart rate to move the same oxygen. That is why 26 June cost me 142 beats a minute to travel slower than a walk.
Acclimation fixes the plumbing. Over a week or so of heat exposure the body expands plasma volume, you start sweating earlier and more efficiently, and the cooling system stops stealing quite so much from the running. Same weather, less tax. The fortnight above is that adaptation happening in real time, written down. This is exactly the sort of thing you cannot feel reliably from the inside. On 1 July I felt strong, but I have also felt strong on runs the data later called mediocre. The watch keeps me honest.
The overnight numbers, and why two devices matter
The runs are the vivid part. The overnight data is the part I actually trust, because it comes from two devices that have never spoken to each other.
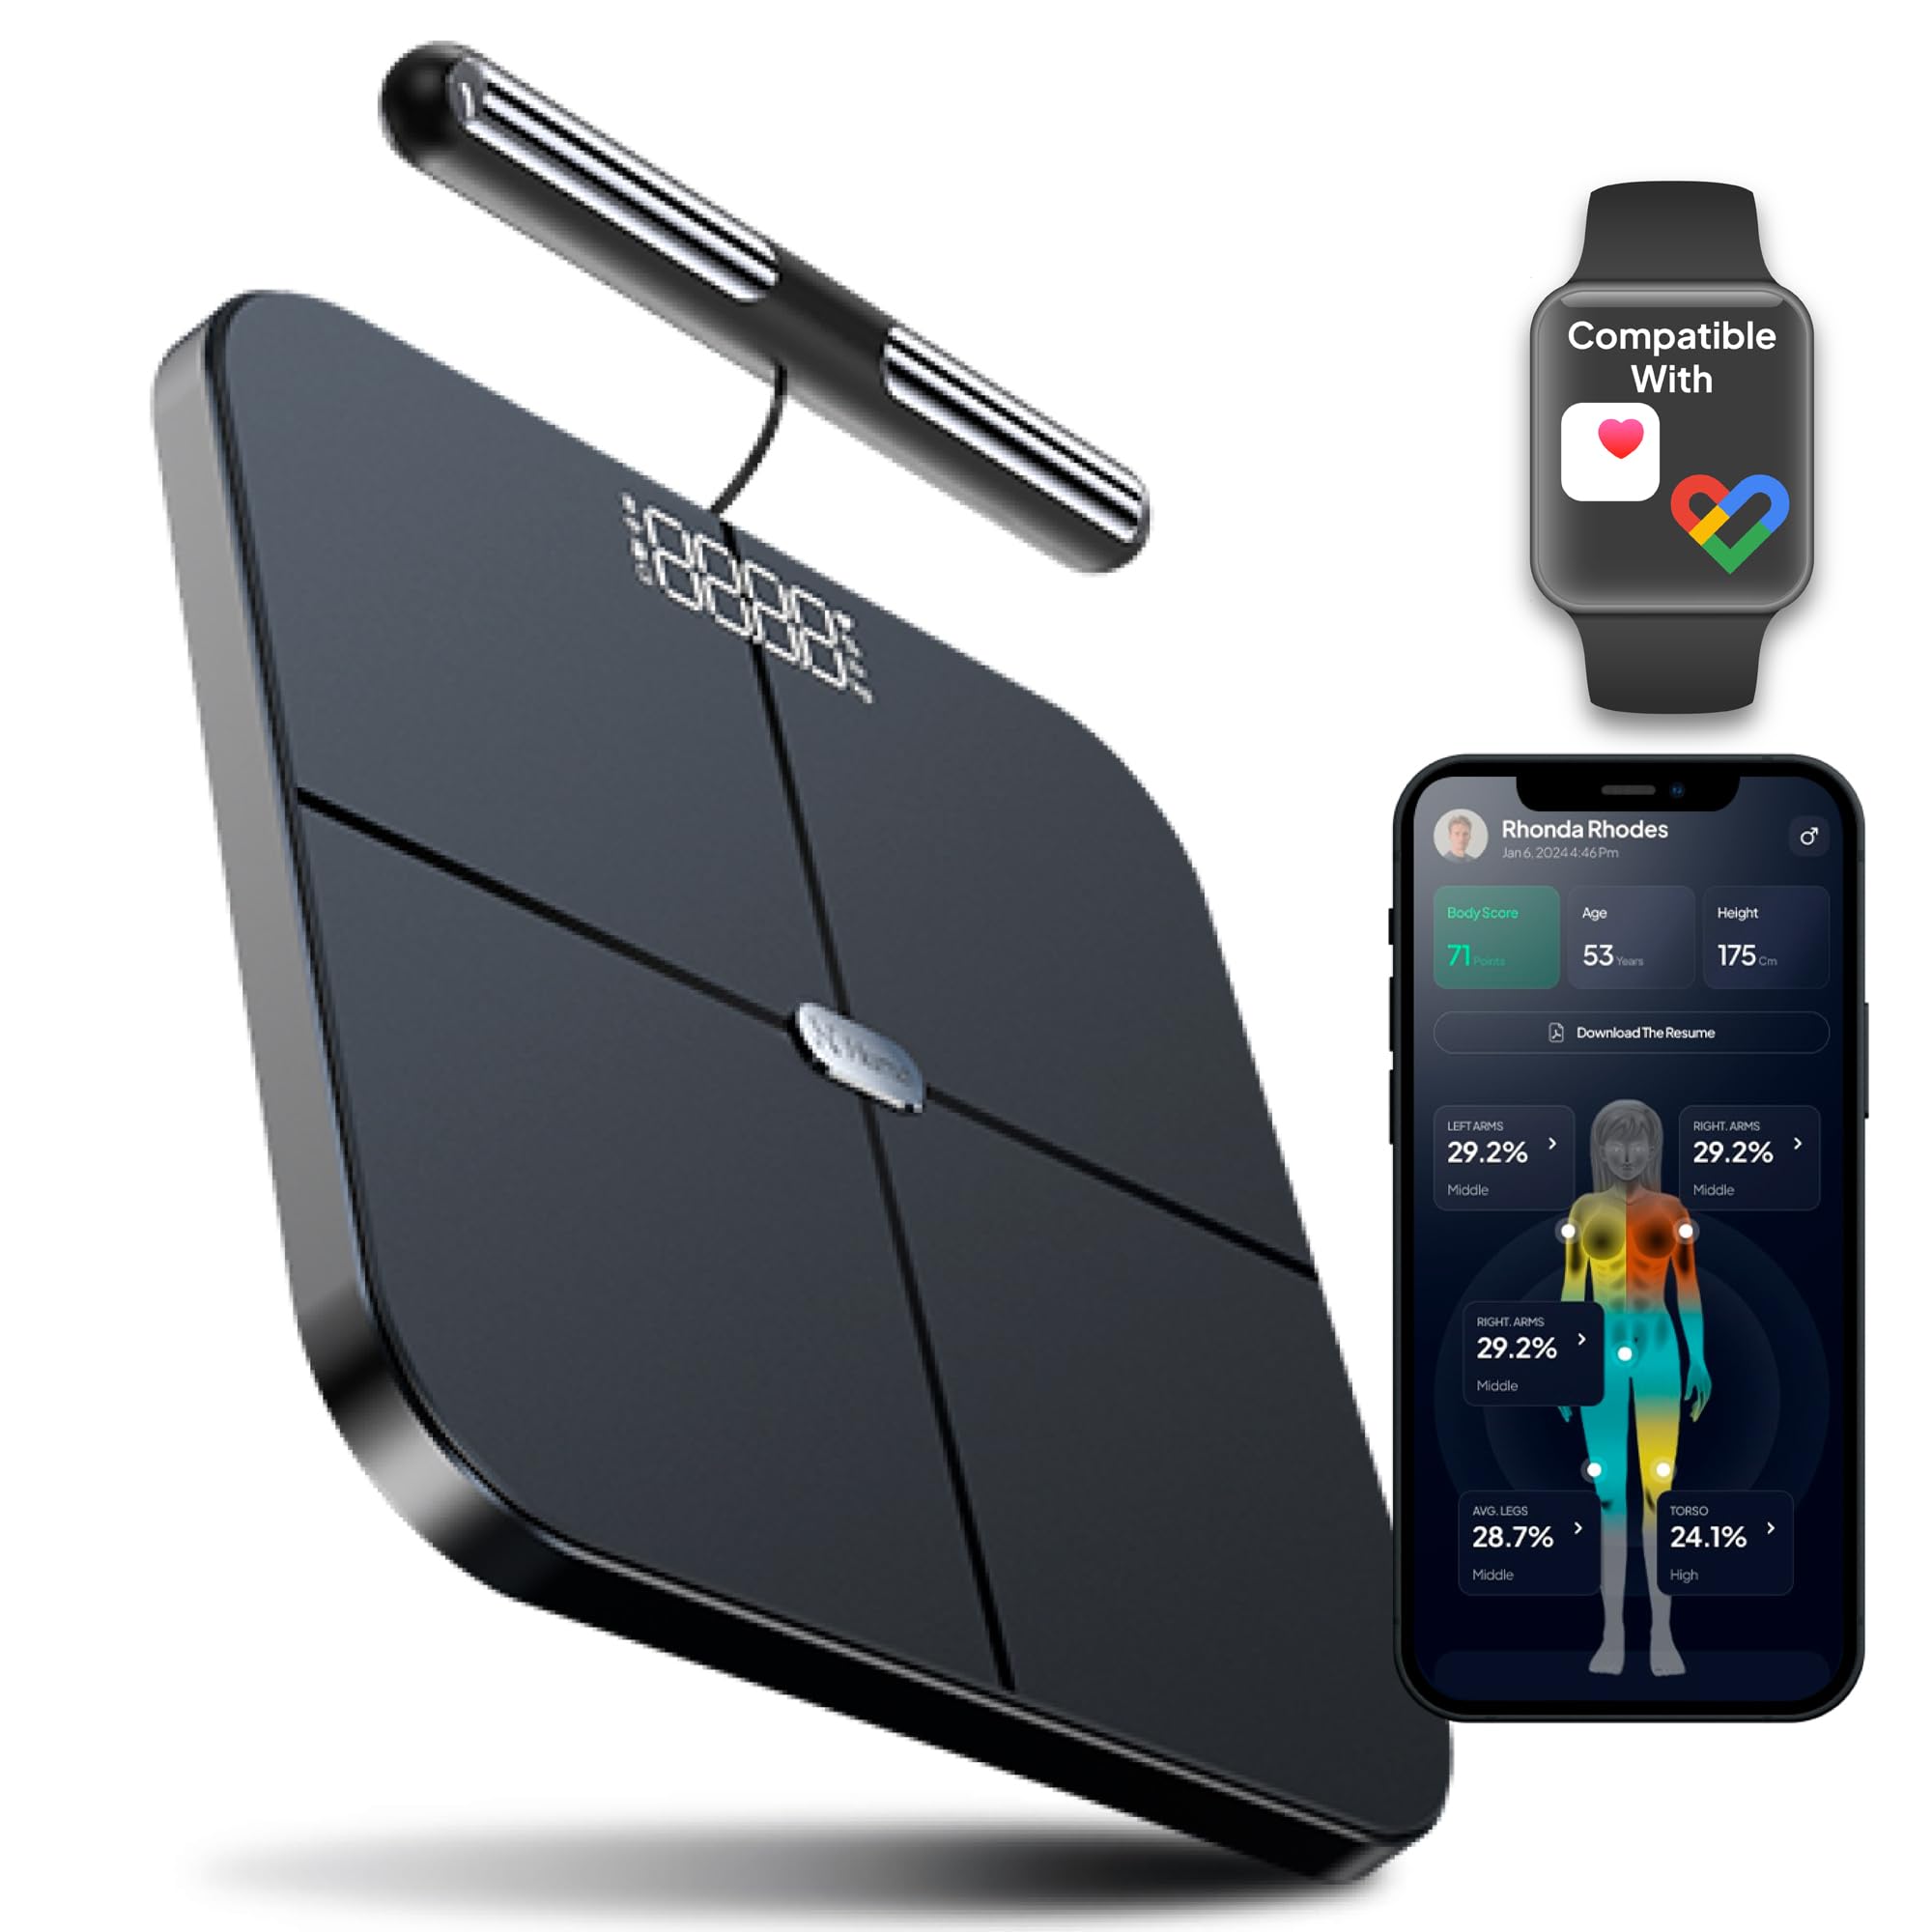
My seven-day HRV average on the Garmin Fenix 8 climbed from 41 to 65 milliseconds across the fortnight, the highest I have ever recorded. Resting heart rate fell from 58 to 52 over thirteen days. That alone would be encouraging, but easy to dismiss as one gadget flattering me.
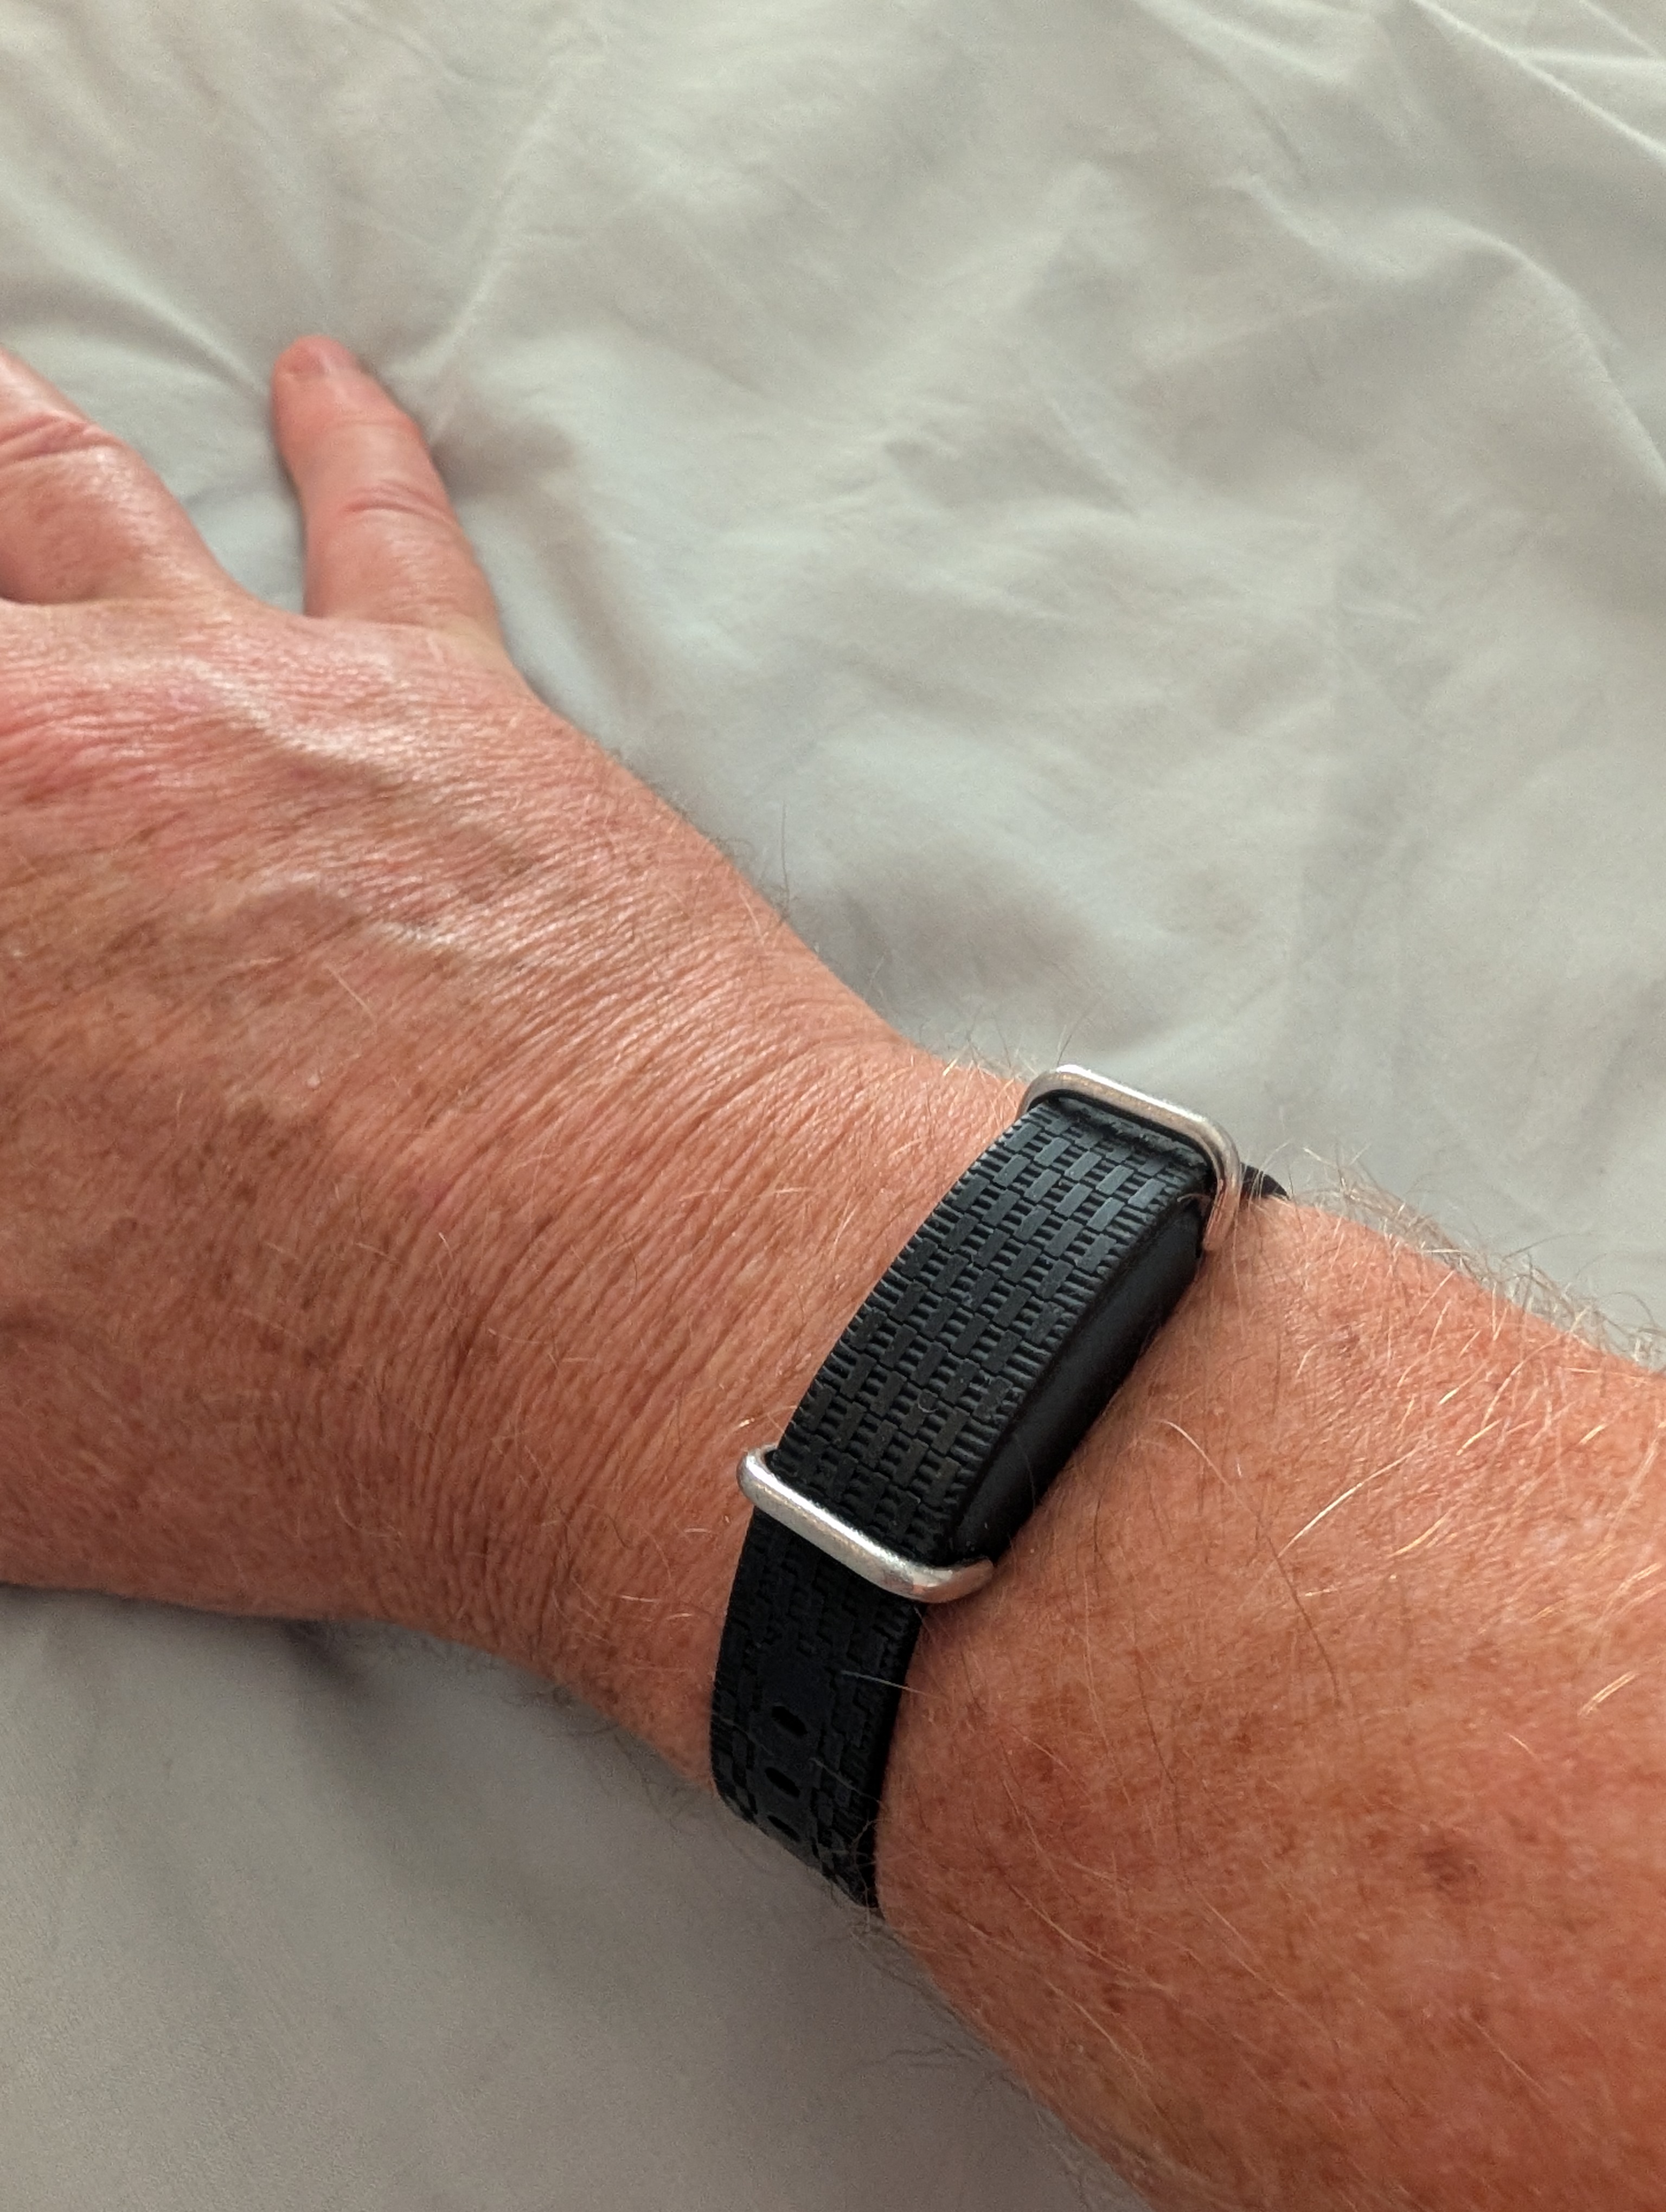
So here is the cross-check. The Hilo, measuring at night by a completely different method, put my night-time heart rate at 51 to 56 in late June. Two independent devices, two different sensors, landing on the same recovering body at around 52 beats a minute. That agreement is the whole reason I bother measuring any of this. One device is a story. Two devices that agree is closer to evidence, though it is still a sample size of one man who cannot sleep.
A caveat on the Garmin, because honesty is the entire point of this blog. It reads heart rate from the wrist optically, and a few of my maximum figures this month look wrong. A 189 on a long run on 20 June, plus a 177 and a 175, are almost certainly cadence-lock artefacts: the watch mistaking footstrike for pulse. I have flagged them for a cardiology review I have coming up, and a chest strap would settle the true peak.
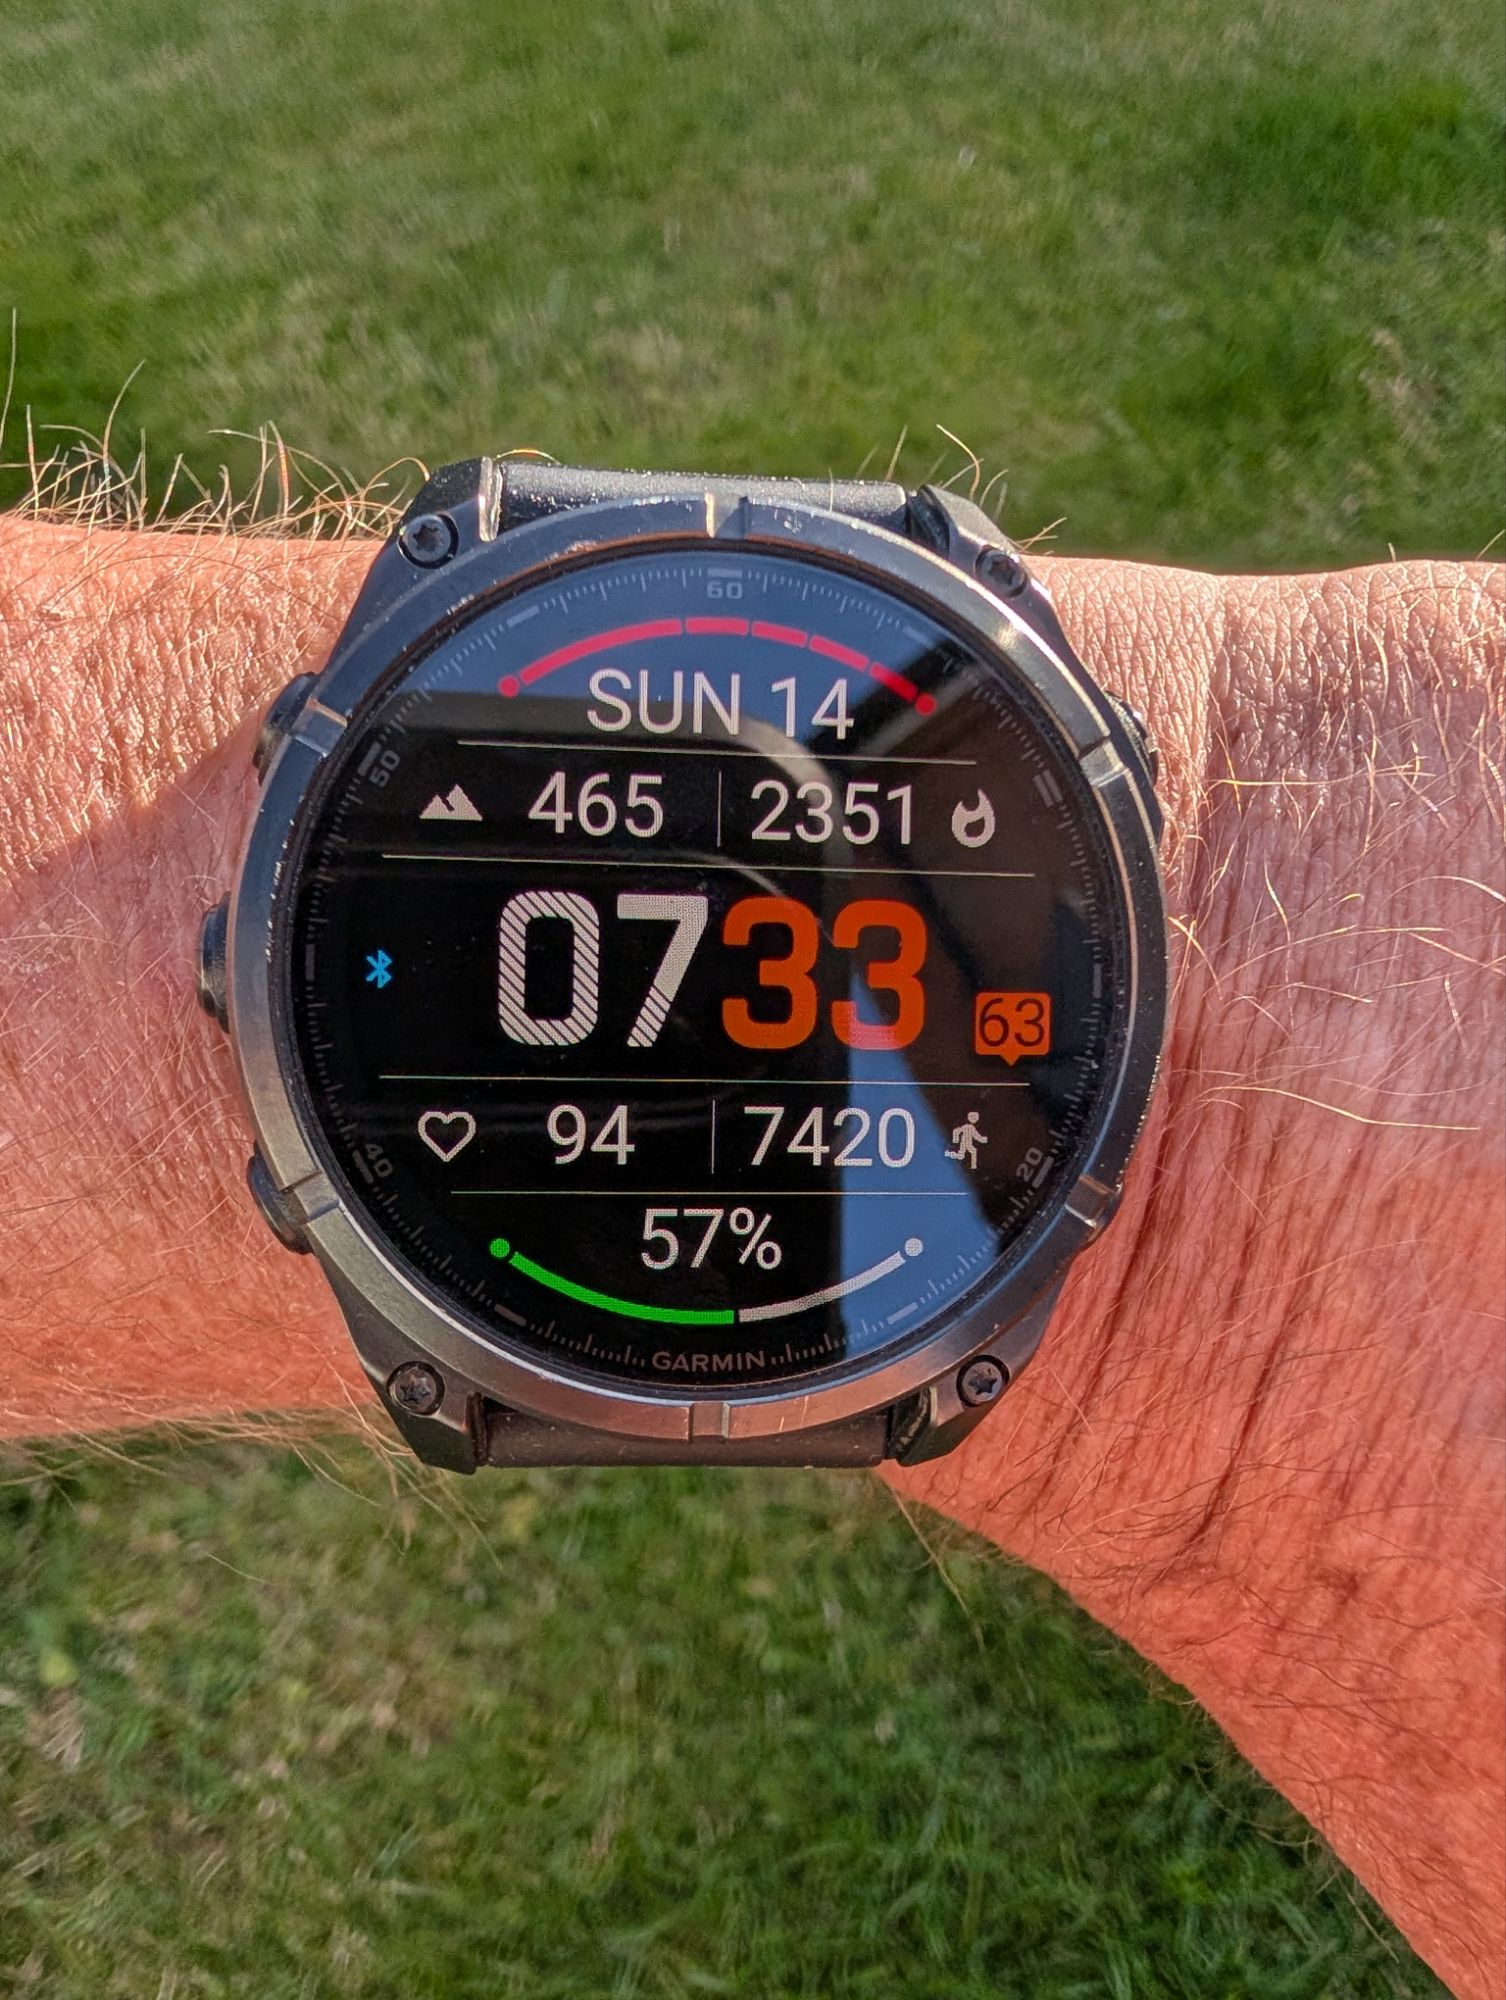
Read the wrist optical max HR with suspicion. Read the overnight resting trends with more confidence. The watch doing all of this is the Garmin Fenix 8. Mine is a specific DLC Sapphire variant that is genuinely hard to find in stock, so here is the standard Fenix 8, which does everything described above.
A word on the beetroot, before anyone asks
Partway through all this I started a proper little trial on beetroot: one shot of Beet It Sport a day, to see whether dietary nitrate does anything measurable to my blood pressure. I want to be completely clear, because this matters. It is far too early to say anything at all. The trial only just began, I am still locking the baseline, and none of the fitness improvement above should be pinned on it.
I am flagging it now rather than have anyone assume later that the beetroot did the heavy lifting. It didn’t. The running did. The beetroot is a separate question, with its own pre-registered experiment and its own reading of the evidence, and I will answer it with data when I have it. Not before.
The bigger picture: reversing a cascade
Long-time readers will know the shape of this. Last December I did my knee. Less running led to weight gain led to higher blood pressure: a slow run of dominoes I only spotted because I had the joined-up data to see it. This fortnight is the first real evidence of the dominoes falling back the other way. Rebuild the aerobic engine and the rest is supposed to follow.
Supposed to. The body-composition side is still lagging badly. I weighed 97.7 kilograms this month, the highest of the whole series, and the scales are not moving yet. VO2max is holding at 39 to 40, which at least means no further de-training, but it is not climbing either. Fitness is a faster-moving needle than weight, and weight is a faster-moving needle than the thing I actually care about, which is the pressure in my arteries.
The blood pressure, honestly
Which brings me to the number I really wanted from this dump. June daytime resting blood pressure came in at 133 over 85, averaged from something like 640 automatic Hilo readings. That 133 is the lowest daytime systolic of the entire post-injury plateau. Since December the number has sat stubbornly in a 134 to 137 band, month after month, and June is the first time it has dropped below it. After six months of a flat line, that genuinely made my week.
Now the discipline, because this is where people oversell. It is easing off the plateau, not a return to baseline. My fit-summer-2025 self sat around 121 to 130, and I am not there.
And here is the caveat that matters most. The June report’s data window closed on 26 June, which is the exact day of my worst run, before the late-June surge had consolidated. In other words, the best fortnight of running I have had in half a year is barely represented in this month’s blood pressure at all. The easing is real, but it is mostly pre-improvement. The payoff from the surge, if it comes, has not shown up yet.
One more honesty note on the Hilo, since it is cuffless and people are rightly sceptical of that. You read the monthly means, not single readings. There is a lone 166 over 104 sitting in the June data from a hot run-day evening, and it is a transient, not the signal. Ignore the spikes. Watch the average of hundreds of readings move.
July is the real test
That is the honest cliffhanger. Blood pressure lags fitness. The fitness turned the corner in the last week of June, and the report that will actually capture it does not exist yet.
It arrives at the end of July, and it will either confirm that the recovering engine drags resting pressure down with it, or it will tell me the relationship is messier than my tidy cascade story would like. Either way I will write it up, because a number you only report when it flatters you is not a measurement. It is marketing.
My weakest lever, meanwhile, is not running or diet. It is sleep. I averaged 5.9 hours a night in June, under six even in my best-HRV week, which is faintly ridiculous given how much of this data I gather at 3am. If I fixed the sleep I suspect everything else would move faster. That is the next thing to chip at.
So: an interim report. Two weeks of heat acclimation running, and the engine is coming back. Two devices that have never met agree the recovery is real, the blood pressure has finally cracked off its plateau, and I am pleased. Cautiously, provisionally, with a July report hanging over me. But pleased.
This is the whole case for measuring your own metrics, by the way. Not the gadgets, and not the graphs for their own sake. It is that when something finally starts working, you can see it in numbers before you can feel it. And when it isn’t working, you find out early enough to do something about it.
About the author
I’m Pete Harrison. I’m 55, I run a business, and I have a mild case of insomnia that means I spend a lot of time at 3am reading about gadgets, gear and ways to make life work better. Things I Learnt at 3am is where I write honestly about the things I’ve actually bought, tested and lived with. No fluff, no rehashing the spec sheet. Just the real verdict, and the real numbers, from someone who uses this stuff every day.